QCoDeS example with tinySA Basic
The tinySA is a USB-controlled spectrum analyser. ## Connect to the instrument
Make sure you have QCoDeS set up (see the QCoDeS website or my notebook 14 minutes to QCoDeS).
In your
qcodesenvironment, install pyserial.Plug the instrument into the USB interface of your computer and turn it on. A good testing configuration is to connect the
HIGHinput port to a signal generator set to 400 MHz and -10 dBm.Run the following code, and check that you get a connect message.
[1]:
import qcodes as qc
from qcodes_contrib_drivers.drivers.TinySA.basic import TinySABasic

qc.Instrument.close_all()
sa = TinySABasic("sa")
sa.get_idn()
Connected to: tinySA tinySA (serial:None, firmware:tinySA_v1.4-175-g1419a93) in 0.00s
[1]:
{'vendor': 'tinySA',
 'model': 'tinySA',
 'serial': None,
 'firmware': 'tinySA_v1.4-175-g1419a93'}
Initialise QCoDeS control
[2]:
%matplotlib inline

import matplotlib.pyplot as plt

from qcodes.dataset import (
    Measurement,
    do0d,
    load_or_create_experiment,
    plot_by_id,
)

qc.initialise_or_create_database_at("./test_tinysa.db")
load_or_create_experiment(
    experiment_name="testing_tinySA",
    sample_name="signal_source",
)
[2]:
testing_tinySA#signal_source#1@c:\Users\lairde\OneDrive - Lancaster University\Desktop\TinySA\Qcodes_contrib_drivers\docs\examples\test_tinysa.db
-------------------------------------------------------------------------------------------------------------------------------------------------
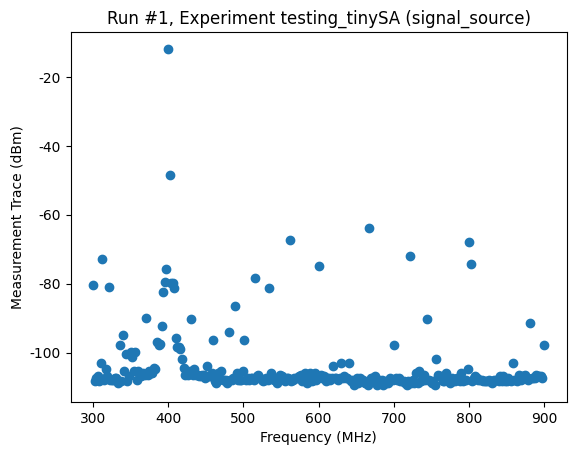
Set up the instrument and make some measurements
The tinySA uses separate low_input and high_input measurement modes. This example measures on the low input across 1 MHz to 300 MHz. For measurements above about 250 MHz, switch to sa.mode("high_input"). Output-generator modes are available as low_output and high_output, but they are not used in the measurement cells below.
[3]:
sa.mode("high_input")
sa.start(300e6)
sa.stop(900e6)
sa.npts(290)
sa.rbw(300e3)

trace_dbm = sa.measurement_trace()
freq_hz = sa.frequency()

meas = Measurement()
meas.register_parameter(sa.frequency)
meas.register_parameter(sa.measurement_trace)

with meas.run() as datasaver:
    datasaver.add_result(
        (sa.frequency, freq_hz),
        (sa.measurement_trace, trace_dbm),
    )
    run_id = datasaver.run_id

plot_by_id(run_id)
Starting experimental run with id: 1.
[3]:
([<Axes: title={'center': 'Run #1, Experiment testing_tinySA (signal_source)'}, xlabel='Frequency (MHz)', ylabel='Measurement Trace (dBm)'>],
 [None])
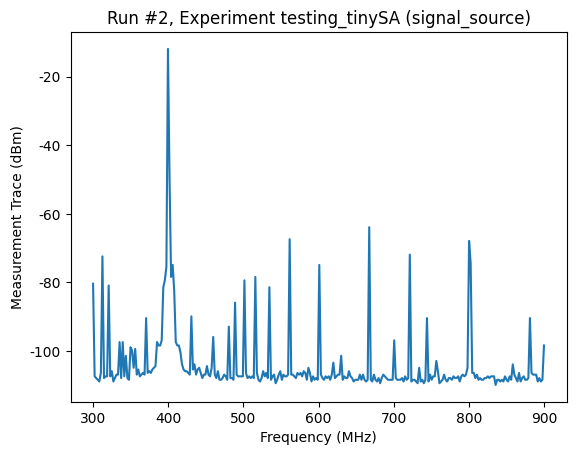
Do a fresh QCoDeS trace measurement
Acquire a new trace using the workhorse do0d(...) command.
[4]:
do0d(sa.measurement_trace, do_plot=True)
Starting experimental run with id: 2. Using 'qcodes.dataset.do0d'
[4]:
(results #2@c:\Users\lairde\OneDrive - Lancaster University\Desktop\TinySA\Qcodes_contrib_drivers\docs\examples\test_tinysa.db
 -----------------------------------------------------------------------------------------------------------------------------
 sa_frequency - array
 sa_measurement_trace - array,
 (<Axes: title={'center': 'Run #2, Experiment testing_tinySA (signal_source)'}, xlabel='Frequency (MHz)', ylabel='Measurement Trace (dBm)'>,),
 (None,))
Close the connection
[5]:
sa.close()